|
|
|
||
|
|
|
||
|
|
Goal 6.0 DELIVER EFFICIENT, EFFECTIVE, AND RESPONSIVE
BUSINESS SYSTEMS AND RESOURCES THAT ENABLE THE SUCCESSFUL
ACHIEVEMENT OF THE LABORATORY MISSION(S)
|
 |
Stanford Linear Accelerator
Center
Performance-Based Management Functional Area: Property |
| Contractor Contractor No.: DE-AC02-76SFO0515 Point of Contact: Leslie Normandin Telephone No.: (650) 926-4350 E-mail: leslie@slac.stanford.edu |
DOE Office LCMD Name: Katherine Woo CO Name: Tyndal Lindler Telephone No.: (650) 926-4963 E-mail: tyndal.lindler@sso.science.doe.gov (SLAC0 |
Date of last assessment: October 2005
The Property Control functional area received an overall rating of Excellent in the FY 2005 Annual Appraisal. Gradients were established and agreed upon for the measurement of inventory performance. Our self-assessment team identified areas of opportunity for enhanced performance and will address those areas in the following report.
Elementary particle physics, accelerator physics and in allied fields that can make use of its synchrotron radiation facilities—including biology, chemistry, geology, materials science and environmental engineering. Operated on behalf of the DOE by Stanford University, SLAC is a national user facility serving universities, industry and other research institutions throughout the world. Its mission can be summarized as follows:
(a) Organizational Mission
The Property Control and Warehouse/Salvage Services Group within Business Services Division is responsible for the control of the government property in SLAC’s possession. This includes marking incoming property, the inventory of equipment and sensitive property, record initiation for property items, operation of the salvage and warehouse function with responsibility for property disposal. Site Security, Fleet Services and Purchasing are not included in this function. The Stanford Site Office last approved the SLAC Personal Property Management System on January 13, 2005.
Names, titles, affiliations of participants
Leslie Normandin, Property Control Manager
Douglas P. Kreitz, Assistant Director Business Services
Division
Tom Murphy, Purchasing Department – SLAC Stores
Alfonso Manuel, Conventional and Experimental Facilities
– Fleet Services
Performance Area: Personal Property Cumulative Available Points: 20 points (Total WEIGHT: 100%)
Performance Objective 1: Customer Perspective:
Effective Services/Partnership (i.e. responsiveness,
cooperation, quality, timeliness, and level of communication).
Data Source: Customer surveys, focus groups and random samples.
Performance Criterion 1.1 - External customer satisfaction: Extent that external customers are satisfied with specific personal property products and services.
Performance measure 1.1.a: Timeliness: Extent of external or customer satisfaction with the timeliness of specific personal property products and services (or) percent of products and services that were delivered to external customers in a timely fashion. Quality: Extent of external customer satisfaction with the quality of the information and services provided (or) percent of products and services that met external customers’ quality expectation. Partnership: Extent of external customer satisfaction with responsiveness, cooperation, and level of communications with the personal property office.
Performance Gradient:
National Target: 80% customer satisfaction rating.
Formula: % of Satisfaction Rating = Total number of surveys
returned w/SAT or higher rating/Total number of surveys
returned
| Outstanding Excellent Good Marginal Unsatisfactory |
80% and UP 70% - 79% 60 – 69% 50% - 59% 40% - 49% |
Process used to meet objective/measure: A customer survey was sent to our external customers with criteria that included timeliness, quality and partnership.
Findings: The survey was sent to seven of our
external customers who currently hold our scrap metals bid,
the Stanford Site Office and to internet sale buyers who
have purchased 2 sales with us in fiscal year 2006. We received
back 6 of the surveys. There were no negative responses.
100 % satisfaction rating = 6 returned surveys with satisfactory
or higher rating/6 surveys returned
Discussion: All the surveys returned from our external customers were rated as agree or strongly agree. Our external customer satisfaction is rated at 100% for an ‘Outstanding’.
Performance criteria:
Timeliness
Quality
Partnership
Performance Criterion 1.2 - Internal customer satisfaction: Extent that internal customers are satisfied with specific personal property products and services.
Performance measure 1.2.a: Timeliness: Extent of external or customer satisfaction with the timeliness of specific personal property products and services (or) percent of products and services that were delivered to external customers in a timely fashion. Quality: Extent of external customer satisfaction with the quality of the information and services provided (or) percent of products and services that met external customers’ quality expectation. Partnership: Extent of external customer satisfaction with responsiveness, cooperation, and level of communications with the personal property office.
Performance Gradient:
National Target: 80% customer satisfaction rating.
Formula: % of Satisfaction Rating = Total number of surveys returned w/SAT or higher rating/Total number of surveys returned
| Outstanding Excellent Good Marginal Unsatisfactory |
80% and UP 70% - 79% 60 – 69% 50% - 59% 40% - 49% |
Process used to meet objective/measure: This fiscal year a customer survey was used to measure performance. An email survey addressed timeliness, quality and partnership.
Findings: The survey was sent to over 400 randomly selected property custodians. We received back 75 surveys or 18.75%. The results were tabulated. One negative response was received.
98.67% Satisfaction Rating = 74 surveys returned with satisfaction or higher rating/75 surveys returned
Discussion: Our overall customer service for Property continues to be above average. The one survey with a negative response concerned the way data is connected between different computer data bases and how it would be helpful to display the node-name. The computer department has been contacted to see if this can be remedied. The rest of the surveys returned were with a satisfactory or higher response. This area has an overall rating of ‘Outstanding’.
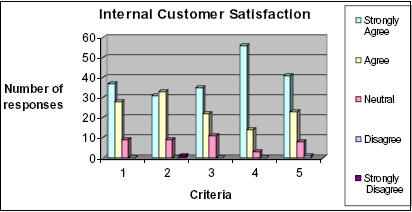
Performance criteria: Scored using scale: Strongly Agree, Agree, Neutral, Disagree, Strongly Disagree
Timeliness
Property Control responds to my request in a timely manner
Quality
Property Control provides accurate information/data Property
Control is knowledgeable of services they provide
Partnership
Property Control is courteous
Property Control is responsive to my requests
Performance Criteria 1.3: Accuracy of and consent to property assignments (internal): percent of sampled property items confirmed by the accountable individual or organization as being property assigned.
Performance Measure 1.3a: Percent of sampled sensitive items confirmed by the accountable individual or organization as being property assigned. (Weight 5%)
Performance Gradient:
National Target: 98% of sensitive items properly assigned.
Formula: % of Accuracy = Number of sampled confirmed, properly
assigned sensitive items/
Total number of sampled assigned sensitive items
| Outstanding Excellent Good Marginal Unsatisfactory |
98% and UP 95.5% - 97% 90.0% – 95.4% 85.0% - 89.9% <85% |
Process used to meet objective/measure: To assess sensitive assignment, a computer-generated list was run and a random sample was chosen for physical verification. DOE Stanford Site Office and the Property Control Group physically verified 30 sensitive items.
Findings: All sensitive items were physically located with the same custodian, except for one item. The custodian listed in the data base recently transferred to another department. The item was reassigned and updated to reflect the new custodian. The rating for this measure is ‘Excellent’.
96.67 % of Accuracy= 29 of sampled confirmed, properly assigned sensitive items/30 total sampled assigned sensitive items
Discussion: One (1) sensitive item was with the same custodian, in the same building but, in a new room.
Performance Measure 1.3b: Percent of sampled equipment items confirmed by the accountable individual or organization as being property assigned. (Weight 5%)
Performance Gradient:
National Target: 98% of equipment items properly assigned.
Formula: % of Accuracy = Number of sampled confirmed, properly
assigned equipment items/Total number of sampled assigned
equipment items
| Outstanding Excellent Good Marginal Unsatisfactory |
98% and UP 95.5% - 97% 90.0% – 95.4% 85.0% - 89.9% <85% |
Process used to meet objective/measure: To assess equipment assignment, a computer-generated list was run and a random sample was chosen for physical verification. Stanford Site Office and a SLAC representative physically verified 30 equipment items.
Findings: The custodian assignment was reviewed for accuracy. All items were physically located with the same custodian. The rating for this measure is ‘Outstanding’.
100 % of Accuracy = 30 sampled confirmed, properly assigned equipment items/30 total sampled assigned equipment items
Discussion: All 30 equipment sample items were physically located. Two (2) items were with the same custodian but in different locations. The property data base has been updated to reflect the change of location.
Performance Objective: 2 Internal Business Perspectives
Effective Life Cycle Management of Assets to Meet Departmental
Missions. Data Source: Physical inventory results, equipment
issue/usage records, excess and surplus property disposal
records. (Total Weight: 20%)
Performance Criterion: 2.1
Asset Accountability: Percent of property subject to physical
inventory located during inventory.
Performance Measure: 2.1.a
Percent of equipment, sensitive property and stores inventory
located during physical inventory (Weight 10%)
Performance Gradients:
National Target: Equipment: 99% (Acquisition Cost)
Formula:
% of Acquisition Cost Located = Amount of equipment acquisition
cost located during physical inventory/Amount of equipment
acquisition cost subject to physical inventory
| Outstanding Excellent Good Marginal Unsatisfactory |
99% and UP 92.3% - 98.9% 98.8% – 98.0% 89.7% to 98.0% <89.70% |
Process used to meet objective/measure: The Laboratory conducted a wall-to-wall inventory for FY2006.
Findings: There were 4,614 items in the equipment category with an acquisition cost of $909,177,553.33. During the reconciliation the inventory team conducted searches for those items unaccounted for. In addition an email was sent to all property custodians soliciting their help in locating the unaccounted for items. The inventory team was able to find all but 20 items with a total acquisition cost of $301,877.47. The percentage of equipment accounted for by cost was 99.97% equating to a rating of ‘Outstanding’.
99.97 % Acquisition Cost Located =
$908,875,675.86 amount of equipment acquisition cost located
during physical inventory/$909,177,553.33 amount of acquisition
cost subject to physical inventory
Discussion: The equipment inventory results continue to show outstanding results. All departments with a 100% find rate will be placed in an article in the SLAC on-line newsletter, ‘SLAC Today’. A certificate will be sent commending all departments having 100% accountability. In addition a memo and computer generated listing will be sent to the division and departments with equipment not located during the inventory cycle.
Performance Gradients:
National Target: Equipment: 98% (Items)
Formula: % Items Located = Number of equipment items located
during physical inventory/
Number of equipment items subject to physical inventory
| Outstanding Excellent Good Marginal Unsatisfactory |
98% and UP 95.5% - 97% 90.0% – 95.4% 85.0% - 89.9% <85% |
Findings:
The inventory team was able to find all but 20 items with
a total acquisition cost of $301,877.47. The percentage
of equipment accounted for was 99.57% equating to a rating
of ‘Outstanding’.
99.57% Items Located = 4594 number of equipment items located during physical inventory/ 4614 Number of equipment items subject to physical inventory
Performance Gradients:
National Target: Sensitive Property: 99% (Acquisition
Cost)
Formula: % of Acquisition
Cost Located = Amount of sensitive item acquisition cost
located during physical inventory/Amount of sensitive item
acquisition cost subject to physical inventory
| Outstanding Excellent Good Marginal Unsatisfactory |
99% and UP 92.3% - 98.9% 98.8% – 98.0% 89.7% to 98.0% <89.70% |
Process used to meet objective/measure: The Laboratory conducted a wall-to-wall inventory for fiscal year 2006.
Findings: The sensitive property inventory category consisted of a total of 4,276 property items with an acquisition cost of $6,964,091.51. During the reconciliation the inventory team conducted searches for those items unaccounted for. In addition an email was sent to all property custodians soliciting their help in locating the unaccounted for items. The inventory team was able to find all but 33 items. The unaccounted-for items had a total acquisition cost of $44,043.66. The percentage of sensitive accounted for by cost is 99.37% equating to a rating of ‘Outstanding’.
99.37% Cost Located = $6,920,047.85 sensitive item acquisition cost located during physical inventory/$6,964,091.51 of sensitive item acquisition cost subject to physical inventory
Discussion: The sensitive inventory results continue to show commendable results. All departments with a 100% find rate will be placed in an article in the SLAC on-line newsletter, ‘SLAC Today’. A certificate will be sent commending all departments having 100% accountability. In addition a memo and computer generated listing will be sent to the division and departments with equipment not located during the inventory cycle.
Performance Gradients:
National Target: Sensitive Property: 98% (Items)
Formula: % Items Located = Number of sensitive items located
during physical inventory/Number of sensitive items subject
to physical inventory
| Outstanding Excellent Good Marginal Unsatisfactory |
98% and UP 95.5% - 97% 90.0% – 95.4% 85.0% - 89.9% <85% |
Findings: The inventory team was able to find all but 33 items with a total acquisition cost of $44,043.66. The percentage of sensitive accounted for by item is 99.23% equating to a rating of ‘Outstanding’.
99.23 % Items Located = 4243 of sensitive items located during physical inventory/4276 of sensitive items subject to physical inventory
Performance Gradients:
National Target: Stores Inventory: 99% (Acquisition
Cost)
Formula: % of Acquisition Cost Located = Amount of stores
inventory cost located/Amount of stores inventory acquisition
cost subject to
inventory
| Outstanding Excellent Good Marginal Unsatisfactory |
99% and UP 92.3% - 98.9% 98.8% – 98.0% 89.7% to 98.0% <89.70% |
Findings: The sum of the cycle counts for the period 10-1-05 through 9-30-06 showed $6,149,199.00 worth of inventory acquisition cost was located. This was divided by a stores inventory acquisition cost subject to inventory (cycle count) of $6,173,551.00. The percent of acquisition cost located is 99.61% equal to a rating of ‘Outstanding’.
99.61 % of Acquisition Cost Located = $6,149,199.00 stores inventory cost located/ $6,173,551.00 stores inventory acquisition cost subject to inventory
Discussion: SLAC stores inventory is determined by a perpetual cycle count method. All items in Stores have a SLAC identification number and cycle counted based on their utilization type. The utilization type is established by its unit cost, the more expensive and/or sensitive items counted more often. Some items are cycle counted more than once during a year.
Performance Gradients:
National Target: Stores Inventory: 98% (Items)
Formula: % Items Located = Number of stores inventory items
located/Number of stores inventory items subject to inventory
| Outstanding Excellent Good Marginal Unsatisfactory |
98% and UP 95.5% - 97% 90.0% – 95.4% 85.0% - 89.9% <85% |
Findings: The number of inventory items located via the cycle count method was 855,561. The number of stores items subject to inventory was 856,780. The percent of items located is 99.86% for a rating of ‘Outstanding’.
99.86 % Items Located = 855,561 number of stores inventory items located/856,780 number of stores inventory items subject to inventory
Discussion: Some items are subject to more than one cycle count per year.
Performance Criterion 2.2: Equipment Utilization: Percent of equipment meeting Federal or local utilization standards or objectives.
Performance Measure 2.2.a: Percent of motor vehicles meeting utilization standards and objectives. (Weight 5%)
Performance Gradients:
National Target: 90% of items meet usage/issue standards.
Formula:
% Vehicle Usage = Total number of vehicles meeting or exceeding
DOE approved utilization
standards/Total number of vehicles subject to approved utilization
standards
| Outstanding Excellent Good Marginal Unsatisfactory |
90% and UP 80% - 89% 70 – 79% 60% - 69% 50% - 59% |
Findings:
73.54% Vehicle Usage = 164 vehicles meeting or exceeding
DOE approved utilization standards 223 vehicles subject
to approved utilization standards
A total of 73.54% gives us a ‘Good’ rating.
Performance Criterion 2.3 Percent of increase in the volume of items reported excess and disposed of within 180 days as compared with the previous cycle.
Performance Measure 2.3.a: SLAC meets the 8% increase of the reported as excess and disposed of within 180 days from previous year. (Weight 5%)
Performance Gradients:
National Target: 8% increase reported as excess from
previous year.
Pass or Fail
Process used to meet objective/measure: A review is conducted of all items entered into EADS. The amount of items and their disposal is tracked for the timeliness of disposal.
Findings: There were 111 items placed in excess this fiscal year. This represents an increase from last fiscal year of 9.01% from fiscal year 2005. During this fiscal year a total of 100% were on time. Currently there are 28 items pending disposal within the 180 days. SLAC has met the target to ‘Pass’ this measure.
Discussion: On average, excess items are resolved within 137 days.
Performance Objective 3.0: Use of Information Technology to Improve Asset Management Performance. Data Source: Personal property data base, surplus property sales records, and supporting documentation. (Total Weight: 5%)
Performance Criterion 3.1: The percent of surplus items sold using “on line” sales media during the year.
Performance Measure 3.1.a: Meets the percentage of items sold on line by 10% (Weight 5%)
Performance Gradients:
National Target: Increase the number of “items” sold “on
line” by 10% per year for three years.
Pass or Fail
Process used to meet objective/measure: The amount of items sold on line were tracked and compared with fiscal year 2005 sales.
Findings: For fiscal year 2006 a total of 20 internet auctions lots were posted with a total of 78 items. Of these items only 48 were sold. On some of the sales the buyer did not meet the minimum bid, were non-responsive or were no longer interested. This is a decrease from last fiscal year of 47 internet auctions lots with a total of 95 items, in which 55 items were sold. SLAC did not increase on-line sales by 10% for a rating of ‘Fail’.
Discussion: The sales are dependant on the number of items we receive for excess. Property Control does not have control over the items turned into the Salvage Group. Each custodian and department decides what is excess to their needs.
Performance Objective/Measure 4: Ensure that personal property acquired via purchase card is recorded in the property and financial management system. (Total Weight: 5%)
Performance Criteria 4.1: Percent of personal property acquired via purchase card is recorded in the property and financial database within 72 hours of receipt of property.
Performance Measure 4.1.a: The percent of personal property acquired with purchase card is recorded within 72 hours of receipt of property. (Weight 5%)
Performance Gradient:
National Target: 98%
Formula: %=Number of items acquired via purchase card recorded
into database within 72hrs of receipt/Total number of items
acquired via purchase card
| Outstanding Excellent Good Marginal Unsatisfactory |
98% and UP 95.5% - 97% 90.0% – 95.4% 85.0% - 89.9% <85% |
Process used to meet objective/measure: The total items acquired by purchase card were tracked by the date the asset was marked against the acquisition date.
Findings: Assets appropriate for marking and acquired on the purchase card was tracked for marking within 72 hours. A total of 210 items were assigned a property control number. Of these 171 were marked within the 72 hour criteria. The gradient for this fiscal year was 81.43% as compared to 70.43 % for fiscal year 2005. This is an ‘Unsatisfactory’ rating.
81.43 % = 171 items acquired via purchase card recorded into data base within 72 hours of receipt/210 items acquired via purchase card
Discussion: The annual Purchase Card training, that all card holders and approvers must attend, stressed the requestor responsibility to notify Property Control when their equipment purchase is received. In addition an email went out to all the custodians and approvers reminding them of the 72 hour criteria. We feel the intent of this measure is for 100% accountability. After the P-Card cycle and reconciliation period ends Property Control runs a monthly report. The report is reviewed for equipment purchases to ensure proper marking. We found no cases of equipment acquired on a purchase card reported to site security as missing before it could be marked. A list of all items not marked within 72 hours for the fiscal year has been sent to the purchase card administrator.
Performance Objective 5: Ensure that subcontractor-held personal property is recorded in the contractor’s property management system. (Total Weight: 5%)
Performance Criterion 5.1: The 98% of subcontractor-held property is identified in the contractor’s property inventory database upon review of invoices and/or scheduled inventories.
Performance Measure 5.1.a: The percent of subcontractor-held property is recorded in contractor’s management system. (Weight 5%)
Performance Gradient:
National Target: 98%
Formula: %=Number of subcontractor-held property recorded
in contractor’s inventory data base/Total number of subcontractors-held
property identified on invoices and/or scheduled inventories
| Outstanding Excellent Good Marginal Unsatisfactory |
98% and UP 95.5% - 97% 90.0% – 95.4% 85.0% - 89.9% <85% |
100 %= 1 - Number of subcontractor-held property recorded in contractor’s inventory data base/1 -Total number of subcontractors-held property identified on invoices and/or scheduled inventories
Findings: A review was conducted of subcontractor held property. Currently there is one equipment item located at a subcontractor facility. This item is recorded in the property data base. This meets the rating for ‘Outstanding’.
Performance Objective/Measure 6.0: Learning and Growth Perspective
Employee Alignment. Data Source: Individual development plans, performance standards, and training schedules. (Total Weight: 10%)
Performance Criterion 6.1: Employee Alignment: Percent of property management employees having performance expectations and training requirements that respond to balanced scorecard objectives.
Performance Measure 6.1.a: Percent of scheduled training, supporting balanced scorecard objectives, completed by personal property management employees during the period. (Weight 4%)
Performance Gradient:
National Target: 90% of scheduled training completed.
Formula: %= Number of personal property management employees
completing scheduled BSC training/Number of personal property
management employees subject to BSC training
| Outstanding Excellent Good Marginal Unsatisfactory |
90% and UP 80% - 89% 70 – 79% 60% - 69% 50% - 59% |
Findings: Everyone in the Property Control Department has appropriate training requirements identified to support their job. The training is reviewed by the supervisor and manager. All training was completed by staff for an ‘Outstanding’ rating.
100%= 6 - Number of personal property management employees completing scheduled BSC training/6 - Number of personal property management employees subject to BSC training
Performance Measure 6.1.b: Percent of personal property professional staff with an individual development plan (IDP) based on balanced scorecard objectives (Weight: 3%)
Performance Gradient:
National Target: 90% of personal property professional
staff has individual development plans.
Formula: %= Number of personal property professional staff
with BSC objective IDPs/Number of personal property professional
staff subject to BSC objective IDPs
| Outstanding Excellent Good Marginal Unsatisfactory |
90% and UP 80% - 89% 70 – 79% 60% - 69% 50% - 59% |
Findings: Everyone in the Property Control group has an individual development plan. The plan includes training requirements as it pertains to meet the goals of the balanced score card, job performance and safety training. This meets the rating of ‘Outstanding’.
100%= 6 - Number of personal property professional staff with BSC objective IDPs/6 - Number of personal property professional staff subject to BSC objective IDPs
Performance Measure 6.1.c: Percent of personal property professional staff that received an annual review of performance against balanced scorecard objectives. (Weight 3%)
Performance Gradient:
National Target: 90% of personal property professional staff
receives annual performance reviews. Formula: % = Number
of personal property professional staff receiving performance
review against BSC objective/Number of personal property
professional staff subject to performance reviews against
BSC objective
| Outstanding Excellent Good Marginal Unsatisfactory |
90% and UP 80% - 89% 70 – 79% 60% - 69% 50% - 59% |
Findings: All the Property staf receives an annual performance evaluation. The evaluation includes goals as it pertains to meeting the balanced scorecard objectives. Their overall performance rating reflects meeting these goals for a rating of ‘Outstanding’.
100%= 6 - Number of personal property professional staff receiving performance review against BSC objective/6 - Number of personal property professional staff subject to performance reviews against BSC objective
Performance Objective 7: Financial Perspective
Objective 1: Optimum Cost Efficiency of Property Management
Operations. Data Source: Accounting Data. (Total Weight:
10%)
Performance Criterion 7.1: Cost of (major) process (e.g. physical inventory, warehousing and disposition).
Performance Measure 7.1.a: The major personal property process identified (Weight 5%)
Performance Gradients:
National Target: Baseline and trend annually.
Pass: Establish a major process, performed baseline and
trend and analysis for minimum of three years.
Fail: Did not establish a major process, nor performed a
baseline and trend.
Findings: The process identified in last year’s self assessment is the physical inventory. The first year we gathered information to be used as a baseline for future trend and analysis. The second year, fiscal year 2006 we tracked the cost to perform the physical inventory. This measure will continue to be tracked next fiscal year.
Performance Measure 7.1.b: Efficiency (cost vs. performance) of targeted processes. (Weight 5%)
Performance Gradients:
National Target: Improving trend (lower cost and/or
performance improvement).
Pass: Established a trend
Fail: Did not establish a trend.
Findings: The cost for the fiscal year physical inventory 2006 averaged around $2.56 per asset. This is an increase from fiscal year 2005, which averaged $2.14. This process will be tracked for another fiscal year.
Discussion: For FY2006 we had temporary people filling in to perform the physical inventory. This resulted in fewer items picked up on the wall-to-wall inventory, due to inexperience. As a consequence, we spent more time on the reconciliation phase of the inventory, which is a more time consuming process.
Performance Objective 8: Ensure the fleet is comprised of vehicles needed to meet the site’s mission and still achieve maximum economy and efficiency. (Total Weight: 5%)
Performance Criterion 8.1: By each non-law enforcement sport utility vehicle (SUV), compare the number of trips made that required driving on other than normal road conditions with the total number of trips the SUV made.
Performance Measure 8.1.a: Non-Law enforcement sport utility vehicle (SUV), compare the number of trips made that required driving other than normal road conditions with the total number of trips the SUV made. (Weight 5%)
Performance Gradient:
National Target: 90% of each SUV’s trips require driving
on other than normal road conditions.
Formula: % Off-Road Trips per SUV = Number of trips logged
on SUV trip logs as “off road”/Total number of trips logged
for each SUV
Pass or Fail
Findings: 10.63 % = 816 trips logged on SUV trip logs as “off road”/7680 total number of trips logged for each SUV
SLAC did not meet the national target for a rating of ‘Fail’.
Performance Objective 9: Ensure SLAC meets the DOE reduction of petroleum consumption requirement of Executive Order 13149, Greening the Government Federal Fleet and Transportation Efficiency. (Total Weight: 5%)
Performance Criterion 9.1: The percent of reduced petroleum consumption within entire motor vehicle fleet, as compared with FY1999 petroleum consumption levels.
Performance Measure 9.1a: As compared with FY1999 petroleum consumption levels, for FY2005, demonstrate a significant improving trend in reducing the net petroleum consumption, and by FY2008, achieve at least 20 percent petroleum consumption reduction. (Weight: 5%)
Performance Gradient:
National Target:
As compared with FY1999 petroleum consumption levels, for
FY2005, demonstrate a significant improving trend in reducing
the net petroleum consumption, and by FY2008, achieve at
least 20 percent petroleum consumption reduction.
Formula:
% Fuel Consumption Reduction = Baseline FY99 fuel consumption
– FY05 fuel consumption/
Baseline FY99 fuel consumption
Findings:
32% reduction = 27538 FY99 baseline – 18677 FY05 fuel consumption/27538 FY99 fuel consumption baseline
20.90% reduction = 27538 FY99 baseline – 21782 FY06 fuel consumption/27538 FY99 fuel consumption baseline
SLAC’s fuel efficiency for fiscal year 2006 increased over fiscal year 2005. This can be attributed in part to the complete power outage at the site. SLAC had to rent power generators. For fiscal year 2006 SLAC reduced its fuel consumption by 20.90% from the baseline fiscal year 1999. We will continue to monitor our fuel consumption for fiscal years 2007 and 2008 to achieve at least 20 percent reduction. SLAC has ‘passed’ this measure.
Pass: Demonstrate a significant improving trend in efficiency
and/or cost for targeted process.
Fail: Did not demonstrate a significant improving trend
in efficiency and/or cost for targeted process.
Performance Objective 10: Property Management Processes
Although SLAC has a functional and approved property system, certain areas have vulnerabilities for potential loss, theft, fraud, abuse or national security concerns. Some of the property processes will require management attention to assure execution of the actions necessary to enhance the existing property management system and reduce vulnerability. (Total Weight: 10%)
Performance Criterion 10.1: Personal Property Management System Personal Property management system is in compliance with the Federal Property Management Regulations (FPMR), the DOE Property management Regulations (DOE-PMR) and applicable DOE Orders to assure the Property Management System are in compliance.
Performance Measure 10.1a: Laboratory Continues to Progress on Potential Area The Laboratory continues to progress on potential area where additional management attention may be required to assure that Property Management System complies with applicable regulations. (Weight: 10%)
Performance Gradient:
Pass: Continued implementation of all recommendations
and actions as stated in the Personal Property Corrective
Action Plan.
Fail: Failed implementation of all recommendations and actions as stated in the Personal Property Correction Action Plan.
Findings: A “Business Peer Review” was conducted at SLAC in April 2006. It included Personal Property. There were no property management recommendations in the final report.
We will continue to work on improving areas in the balanced score card.